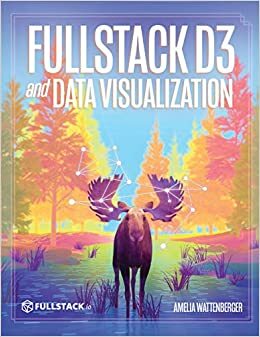
Take a photo of a barcode or cover

595 pages • first pub 1151 (view editions)
ISBN/UID: None
Format: Hardcover
Language: English
Publisher: Fullstack.io
Edition Pub Date: 31 May 1971

Description
What’s the best way to draw a chart within React? It turns out that there is a fair bit of overlap in functionality between a React and D3 – we’ll discuss how we can create blazing fast charts using the two together. With Fullstack D3 and Data Vi...
Community Reviews

Content Warnings


595 pages • first pub 1151 (view editions)
ISBN/UID: None
Format: Hardcover
Language: English
Publisher: Fullstack.io
Edition Pub Date: 31 May 1971

Description
What’s the best way to draw a chart within React? It turns out that there is a fair bit of overlap in functionality between a React and D3 – we’ll discuss how we can create blazing fast charts using the two together. With Fullstack D3 and Data Vi...
Community Reviews

Content Warnings
