Take a photo of a barcode or cover

248 pages • missing pub info (view editions)
ISBN/UID: 9781138707603
Format: Paperback
Language: English
Publisher: CRC Press
Edition Pub Date: 06 December 2018

Description
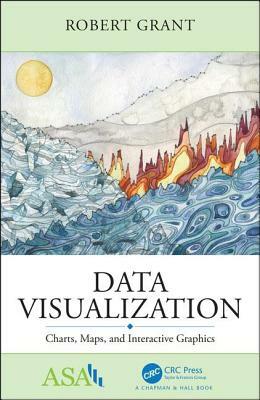
This is the age of data. There are more innovations and more opportunities for interesting work with data than ever before, but there is also an overwhelming amount of quantitative information being published every day. Data visualisation has beco...
Community Reviews

Content Warnings


248 pages • missing pub info (view editions)
ISBN/UID: 9781138707603
Format: Paperback
Language: English
Publisher: CRC Press
Edition Pub Date: 06 December 2018

Description
This is the age of data. There are more innovations and more opportunities for interesting work with data than ever before, but there is also an overwhelming amount of quantitative information being published every day. Data visualisation has beco...
Community Reviews

Content Warnings
